

ESP32 Memory Management Deep Dive: SRAM, PSRAM, Heap and FreeRTOS Stacks
A practical ESP32 memory guide covering SRAM layout, PSRAM usage, heap fragmentation, RTOS task stacks, and small optimization tricks that are useful in real firmware.
Share
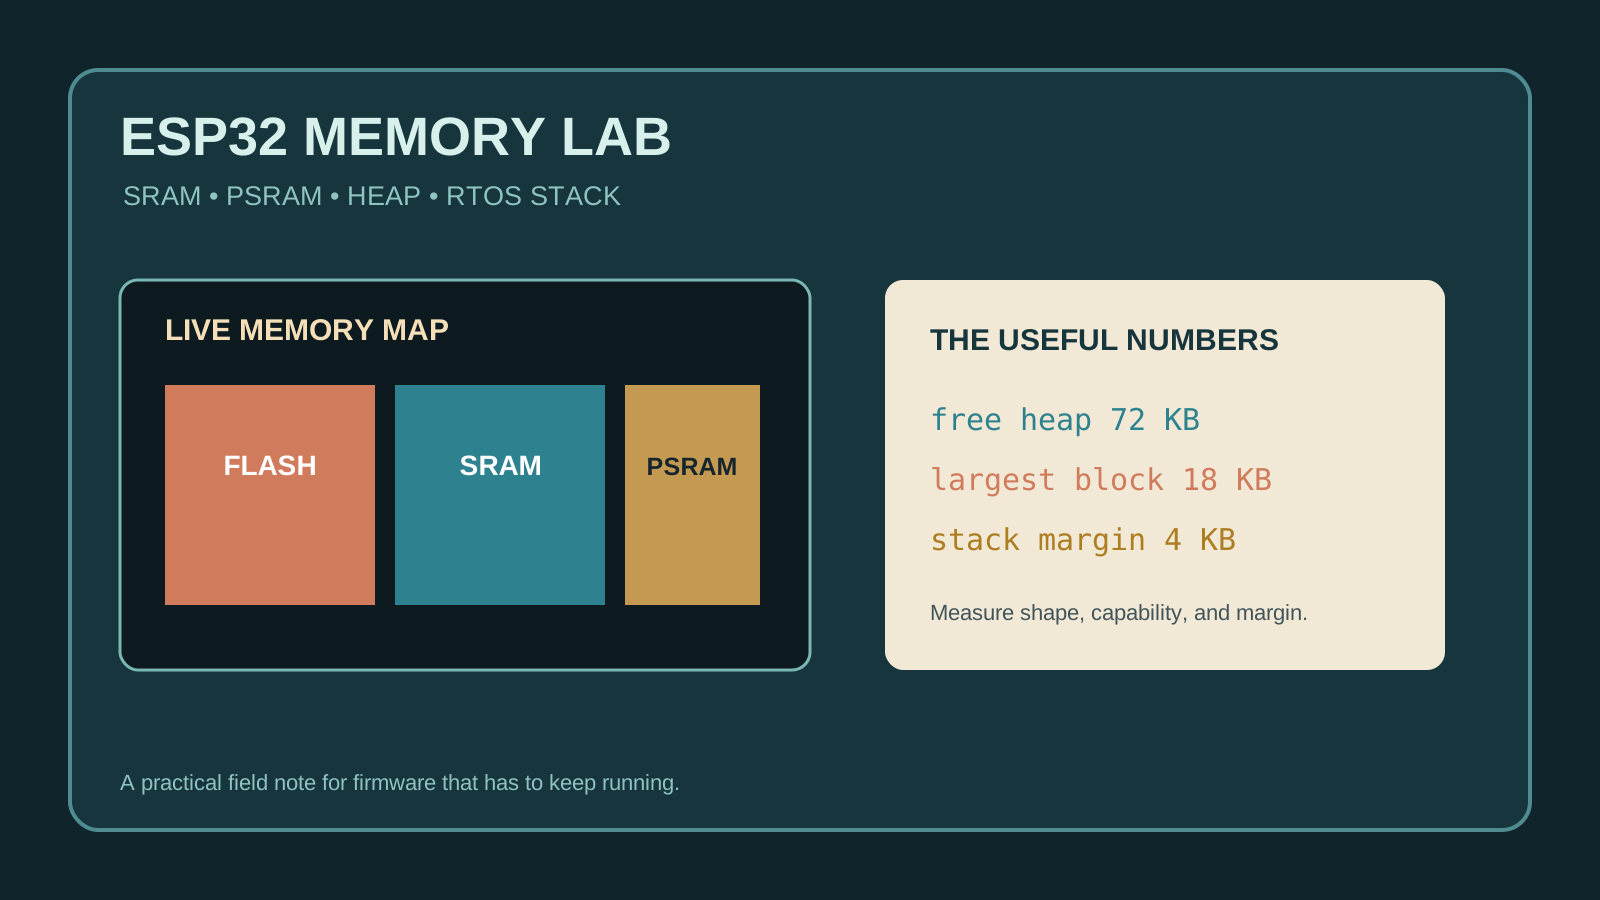
ESP32 memory problems rarely appear as one clean error. The board boots, Wi-Fi connects, the UI looks fine, and then a large buffer allocation fails after a few hours. Or a task crashes only when audio and networking happen at the same time.
The useful mental model is not “how many kilobytes are free?” It is: which memory can do this job, and how much of that memory is available in one usable block?
1. SRAM is not one big bucket
ESP-IDF separates memory by capability. Internal SRAM is used for data (DRAM), instructions that must run with the cache disabled (IRAM), static data, and the internal heap. Flash-backed IROM/DROM is useful for code and constants, but it is not a replacement for writable RAM.
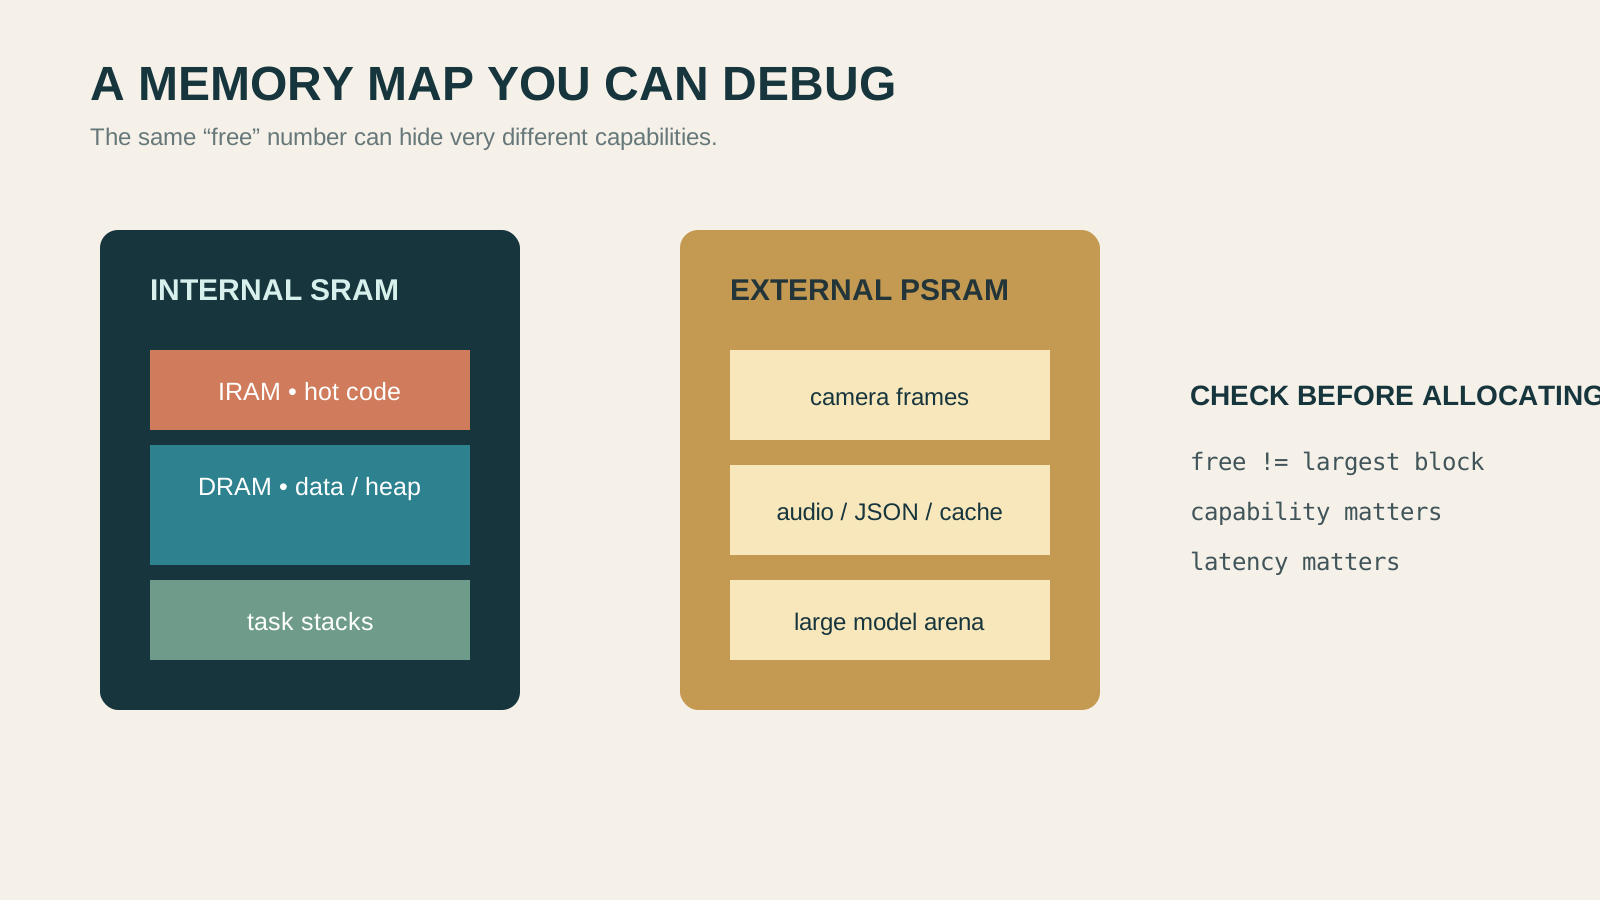
Total free memory is only half the story; the capability and largest contiguous block matter too.
That is why two numbers can both be true:
free internal heap: 72 KB
largest internal free block: 18 KB
There may be 72 KB in total, but a 24 KB contiguous request still fails. For buffers, DMA, and some driver paths, the largest free block is often more interesting than the total free heap.
I normally inspect all three values while the system is under load:
#include "esp_heap_caps.h"

ESP_LOGI(TAG, "internal free=%u largest=%u low=%u",
    heap_caps_get_free_size(MALLOC_CAP_INTERNAL | MALLOC_CAP_8BIT),
    heap_caps_get_largest_free_block(MALLOC_CAP_INTERNAL | MALLOC_CAP_8BIT),
    heap_caps_get_minimum_free_size(MALLOC_CAP_INTERNAL | MALLOC_CAP_8BIT));
The low-water mark tells you how close the application has come to its worst observed point. Log it after startup, after connecting Wi-Fi, after opening the screen, and during the busiest operation—not only at idle.
2. Use PSRAM for the right kind of pressure
PSRAM is excellent for large, byte-addressable data: camera frames, image buffers, audio workspaces, JSON documents, caches, and model arenas. It gives a board breathing room without pretending that external RAM has the same latency or access rules as internal RAM.
I keep the hot path in internal memory where possible. Small control structures, DMA buffers, network housekeeping, and data touched inside timing-sensitive code should not be moved blindly to PSRAM. Flash operations can also temporarily disable the cache, so tasks involved in those paths need an internal stack; ESP-IDF documents this constraint explicitly.
For an explicit allocation, make the decision visible in code:
uint8_t *frame = heap_caps_malloc(frame_size,
                                  MALLOC_CAP_SPIRAM | MALLOC_CAP_8BIT);
if (!frame) {
    ESP_LOGE(TAG, "no PSRAM buffer for %u bytes", frame_size);
    return ESP_ERR_NO_MEM;
}
If the allocation must be DMA-capable or executable, PSRAM is usually the wrong choice. Check the component API's capability requirements instead of assuming that every malloc() result is interchangeable.
One practical rule: use PSRAM to hold bulk data, not to hide an uncontrolled allocation pattern. Moving a leak from SRAM to PSRAM only makes the crash arrive later.
3. Heap fragmentation is about the shape of free space
Fragmentation happens when long-lived and short-lived allocations are mixed. A common embedded example is repeatedly creating variable-sized strings, JSON documents, or network packets while a few large buffers stay alive. Total free memory can look healthy while the free space is split into small holes.
The simplest experiment is to record both free bytes and the largest free block before and after a workload:
static void log_heap(const char *where)
{
    size_t free8 = heap_caps_get_free_size(MALLOC_CAP_8BIT);
    size_t largest = heap_caps_get_largest_free_block(MALLOC_CAP_8BIT);
    ESP_LOGI(TAG, "%s: free=%u largest=%u", where, free8, largest);
}
If free stays roughly stable but largest keeps falling, look for allocation churn. My usual fixes are simple:
- Allocate fixed-size buffers once during startup.
- Reuse a scratch buffer instead of allocating per message.
- Give ownership of a buffer to one task and return it through a queue.
- Keep similarly lived objects together, rather than mixing temporary and permanent data.
- Reserve capacity for strings or containers when their upper bound is known.
For a suspected leak or overwrite, enable heap poisoning or heap tracing in a debug build. Heap tracing can show allocation callers and, in the appropriate mode, where a block was freed. It adds overhead, so I do not leave it enabled in a production performance build.
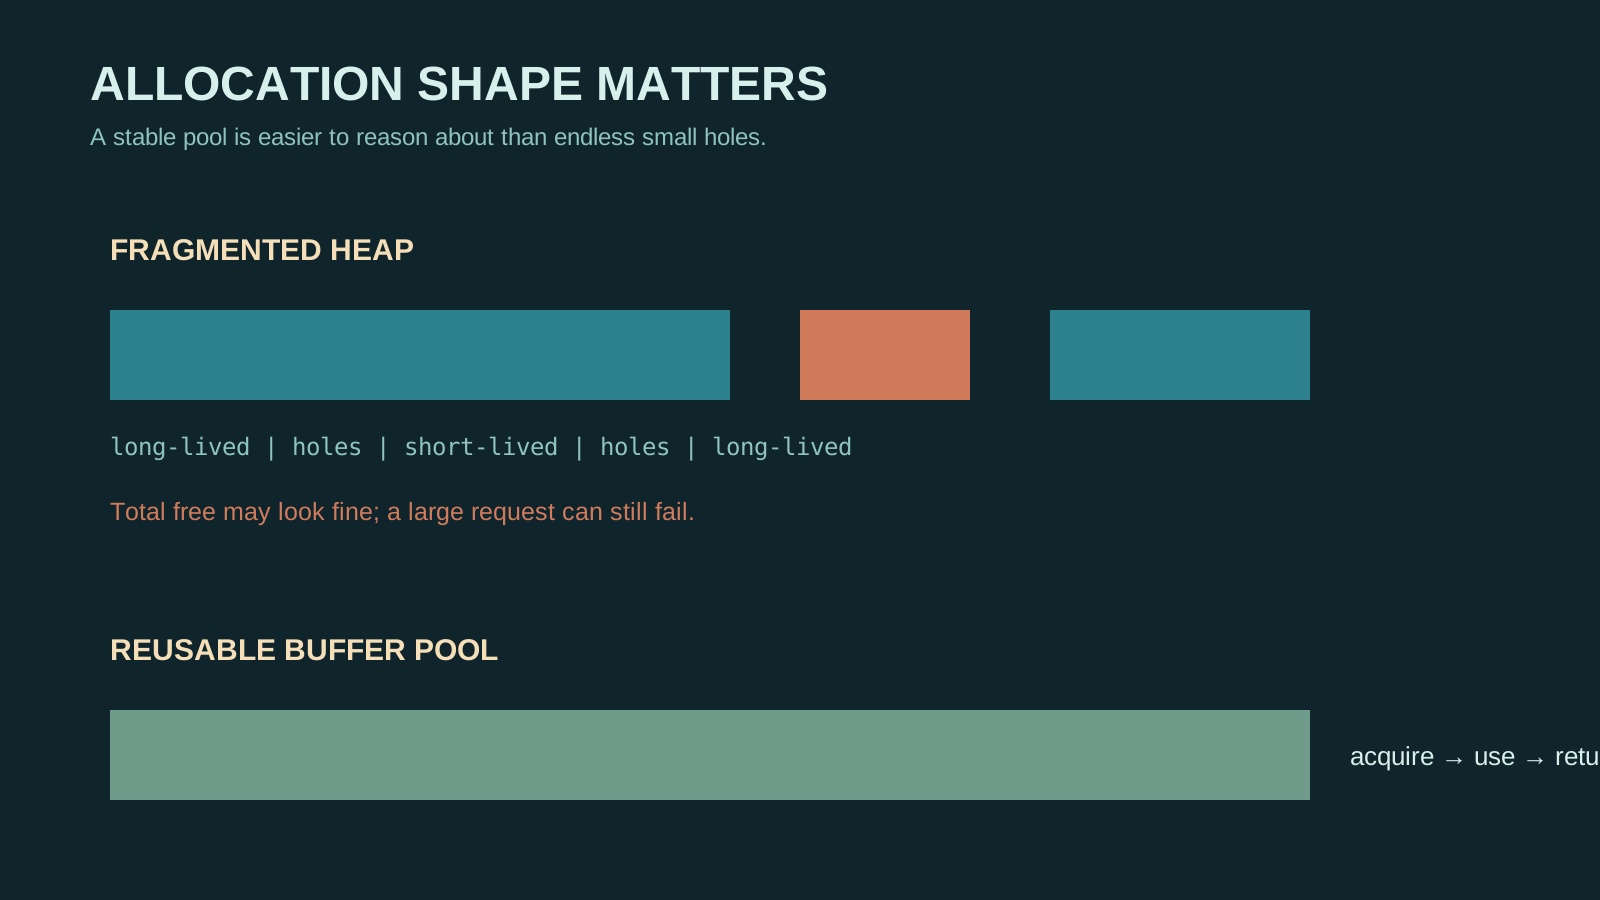
Reusing buffers keeps short-lived data from punching holes between long-lived allocations.
4. FreeRTOS stacks are allocations too
Every task needs a stack. On ESP-IDF, task stacks are commonly allocated from the heap, so an oversized stack is not just wasted “task space”; it consumes the same memory pool your buffers may need.
Start with a reasonable size, exercise the real task, then measure its high-water mark:
void sensor_task(void *arg)
{
    for (;;) {
        read_sensor();
        ESP_LOGD("sensor", "stack spare=%u bytes",
                 uxTaskGetStackHighWaterMark(NULL));
        vTaskDelay(pdMS_TO_TICKS(1000));
    }
}
On ESP-IDF, the returned value is reported in bytes. It is the minimum unused stack observed during the task's lifetime. Run the task through the largest JSON payload, longest log line, and busiest error path before deciding that the margin is safe.
I avoid large local arrays in tasks. A uint8_t packet[8192] inside a task can quietly consume most of its stack; a deliberately allocated buffer makes its lifetime and memory capability easier to inspect. Enable stack overflow checking in debug configurations, but remember that canaries cannot catch every possible overflow pattern.
Static allocation can also be useful when a task's lifetime is fixed. It makes ownership clearer and removes one runtime heap operation, but it does not make the memory free—the stack still has to live somewhere.
5. Small optimizations that usually pay off
The best optimizations are often boring:
- Put constant lookup tables in flash when they do not need to be modified.
- Avoid copying full structs when a pointer or a small message descriptor is enough.
- Use a ring buffer for streaming audio or serial data instead of allocating every chunk.
- Keep log formatting out of tight loops; formatted strings can need surprisingly large temporary stacks.
- Use
heap_caps_malloc()for important buffers so an accidental capability mismatch fails near the cause. - Measure after enabling Wi-Fi, Bluetooth, display, and OTA. Each component changes the memory budget.
Do not optimize from the boot log alone. A firmware that has 200 KB free at boot may have a very different budget after the radio, TLS, display driver, and application tasks are all alive.
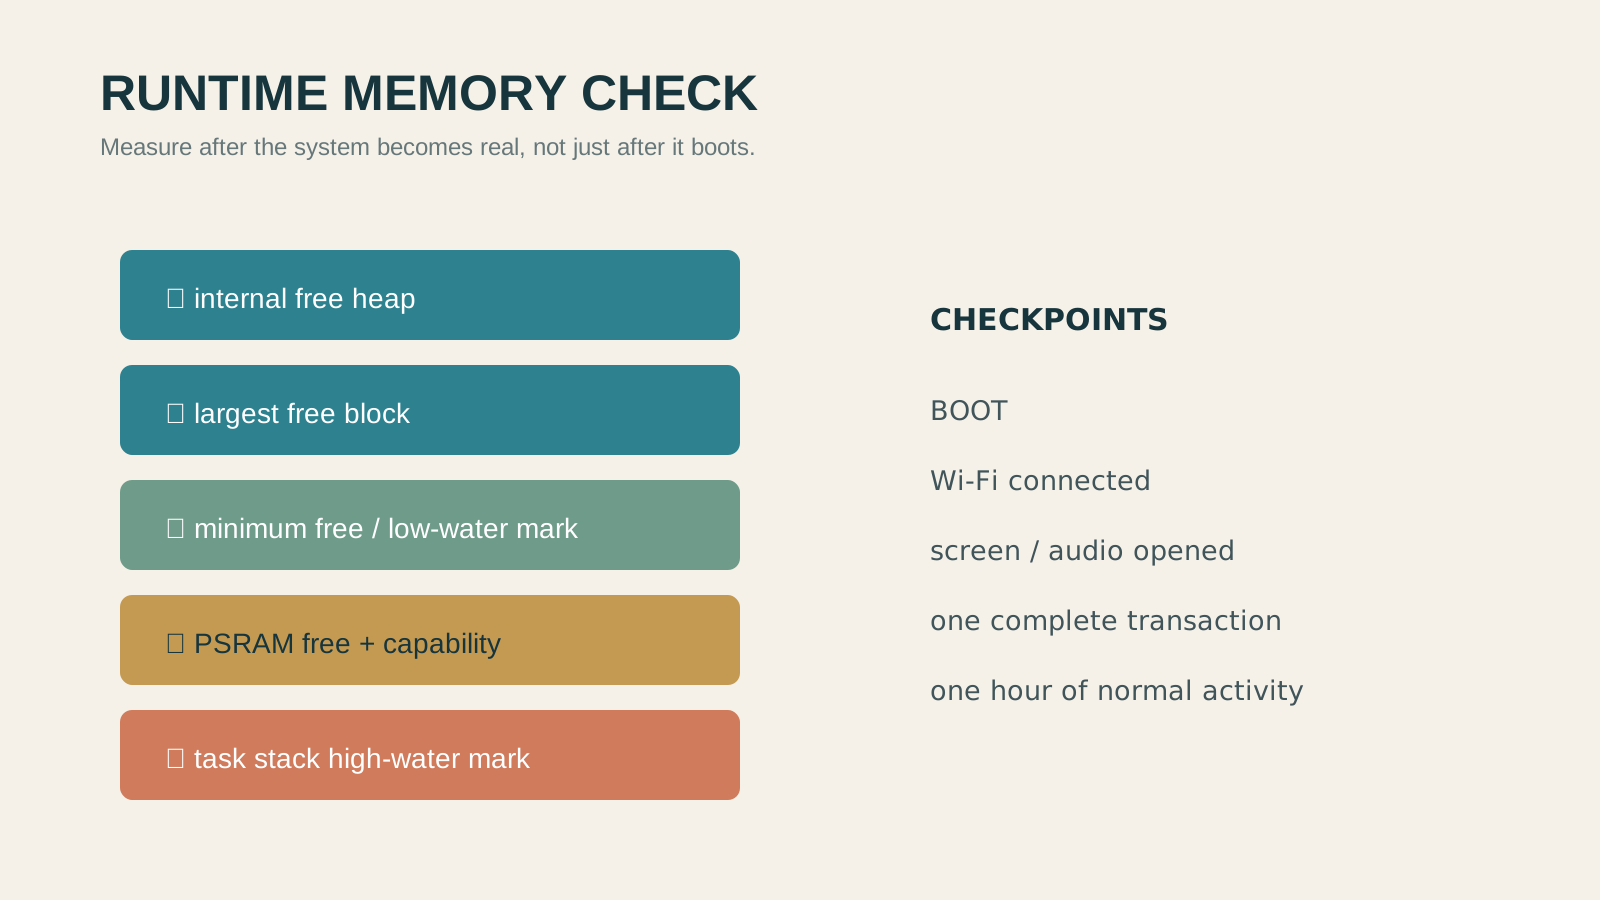
Measure at real workload checkpoints, not only immediately after boot.
A workflow I actually use
First, record internal free heap, largest free block, PSRAM free heap, and every task's stack high-water mark. Then repeat the measurement at meaningful checkpoints: boot, Wi-Fi connected, screen opened, one complete transaction, and one hour of normal activity.
If the failure is a large allocation, compare total free bytes with the largest block. If the largest block decays, investigate fragmentation. If both decay, investigate a leak or an object that grows without a bound. If the heap looks stable but a task crashes, inspect its stack margin and local arrays.
Memory management on ESP32 becomes much less mysterious when every buffer has an answer to three questions: which memory capability does it need, who owns it, and when is it released? Put those answers in the code and the logs, and most “random” memory failures become ordinary engineering problems.
References
Share
Keep exploring
Read next
Related articles
Real-Time Operating System (RTOS): FreeRTOS on ESP32
A beginner-friendly guide to using FreeRTOS on ESP32 for multitasking firmware with tasks, queues, notifications, mutexes, and practical debugging habits.
RISC-V Embedded Development: Getting Started with ESP32-P4
A practical ESP32-P4 RISC-V guide: install ESP-IDF, select the esp32p4 target, build a first project, flash over USB, and understand the dual-core architecture.
18 Common ESP32 Errors – Part 2: Critical Errors
How I read ESP32 backtraces and troubleshoot crashes, watchdogs, heap, stack, FreeRTOS, Wi-Fi, ADC, deep sleep, and OTA with a practical runtime checklist.