

18 Common ESP32 Errors – Part 2: Critical Errors
How I read ESP32 backtraces and troubleshoot crashes, watchdogs, heap, stack, FreeRTOS, Wi-Fi, ADC, deep sleep, and OTA with a practical runtime checklist.
Share
In Part 1, I worked upward from power, BOOT, and serial logs to GPIO and buses. A harder group begins after the board boots: it runs for minutes or days, then crashes, hangs, loses its connection, or fails an OTA update.
Random component swaps rarely help here. I want to preserve evidence in this order:
Reset reason → backtrace → watchdog → heap/stack → task → network → power → OTA
I use ESP-IDF API names because they expose the most diagnostic information. If you use Arduino-ESP32, most causes remain the same because the framework still runs on ESP-IDF and FreeRTOS underneath.
1. Guru Meditation and backtraces: do not stop at the first line
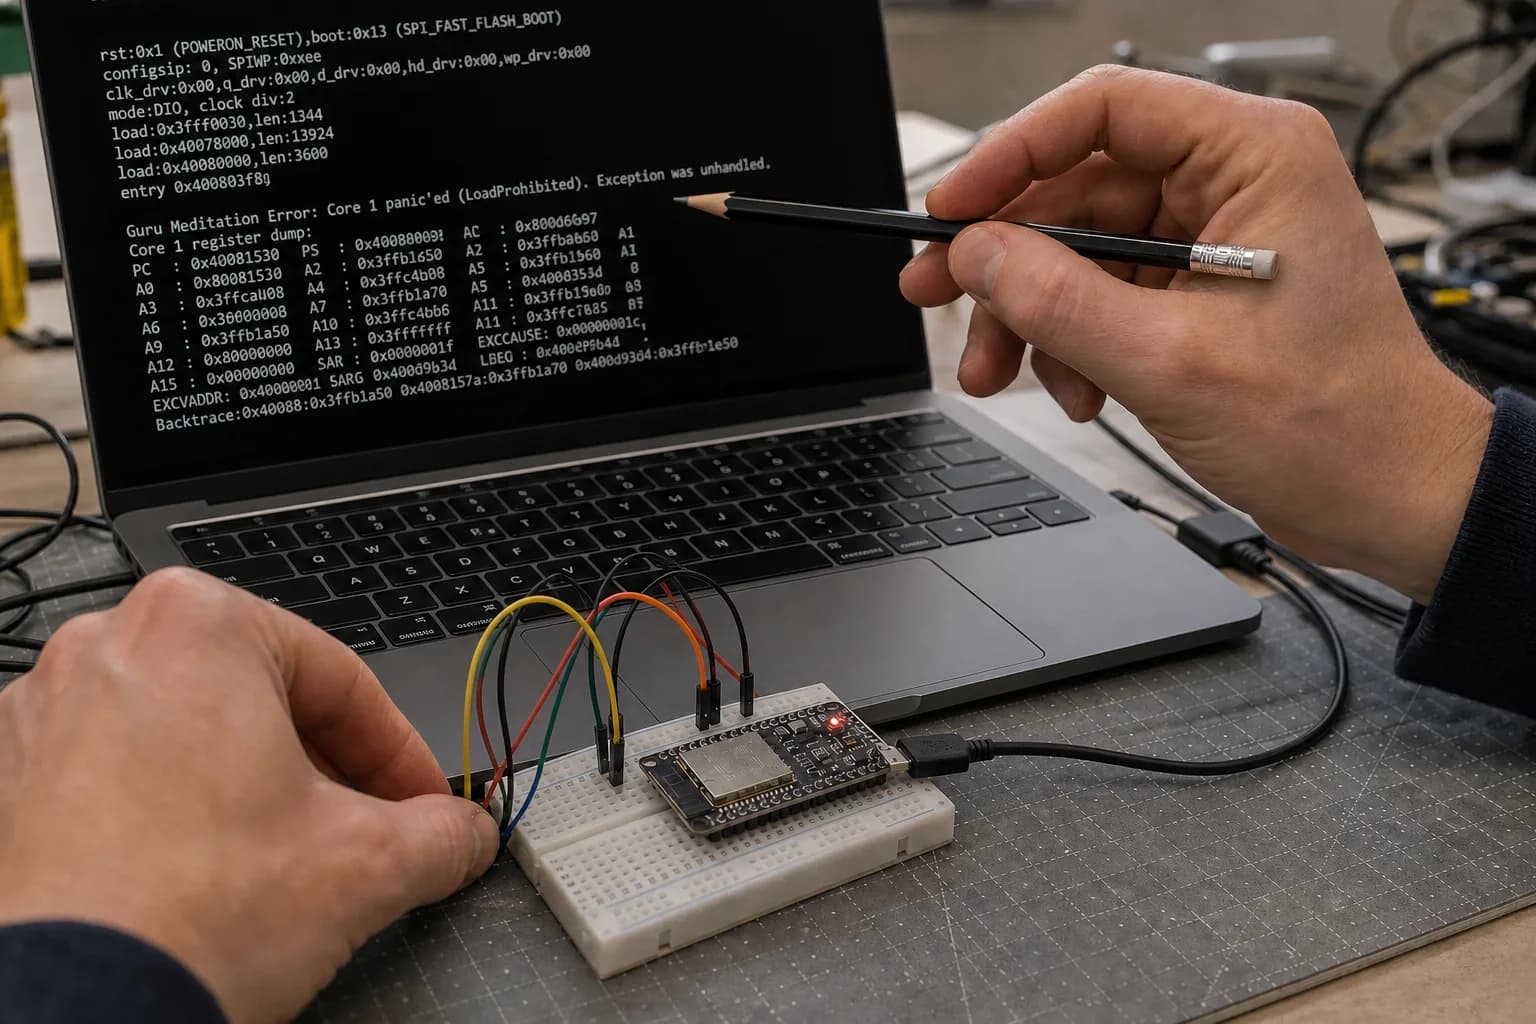
A complete log and the matching ELF turn a crash address into a source line you can inspect.
A log like this says much more than “the ESP32 reset itself”:
Guru Meditation Error: Core 1 panic'ed (LoadProhibited)
EXCVADDR: 0x00000000
Backtrace: 0x400d2abc:0x3ffb1f20 0x400d31f1:0x3ffb1f50 ...
The three exceptions I see most often are:
LoadProhibited: the CPU read from an invalid address.StoreProhibited: the CPU wrote to an invalid address.IllegalInstruction: the CPU tried to execute an invalid instruction. A familiar cause is a task function returning instead of deleting itself withvTaskDelete(NULL). Flash-access problems, a damaged function pointer, or overwritten stack data can also lead here.
Look at EXCVADDR as well. 0x00000000 usually suggests a null-pointer dereference. An address close to zero can be a struct member accessed through a null pointer. A garbage address in an unexpected region points toward an uninitialized, overwritten, or already-freed pointer.
These three patterns are common crash sources:
sensor_t *sensor = NULL;
printf("%d", sensor->value);       // null pointer

samples[count] = value;            // count exceeds the array

free(frame);
send_frame(frame);                 // use-after-free
A backtrace is useful only when decoded with the .elf file matching the firmware on the device. idf.py monitor normally resolves addresses to functions and source lines automatically. For a manual lookup on the original ESP32, you can use:
xtensa-esp32-elf-addr2line -pfiaC -e build/app.elf 0x400d2abc
ESP32-C3 uses the RISC-V toolchain, while S3 uses its corresponding Xtensa toolchain. Do not decode an old crash with a newly built ELF; an address may still resolve to a plausible but incorrect function.
I skip panic-handler frames and find the first frame belonging to application code. Then I inspect parameters, buffer lifetime, and index calculations around that line. For difficult use-after-free or out-of-bounds writes, heap poisoning, integrity checks, and watchpoints are more useful than adding logs everywhere.
2. Task Watchdog: which task is refusing to yield?
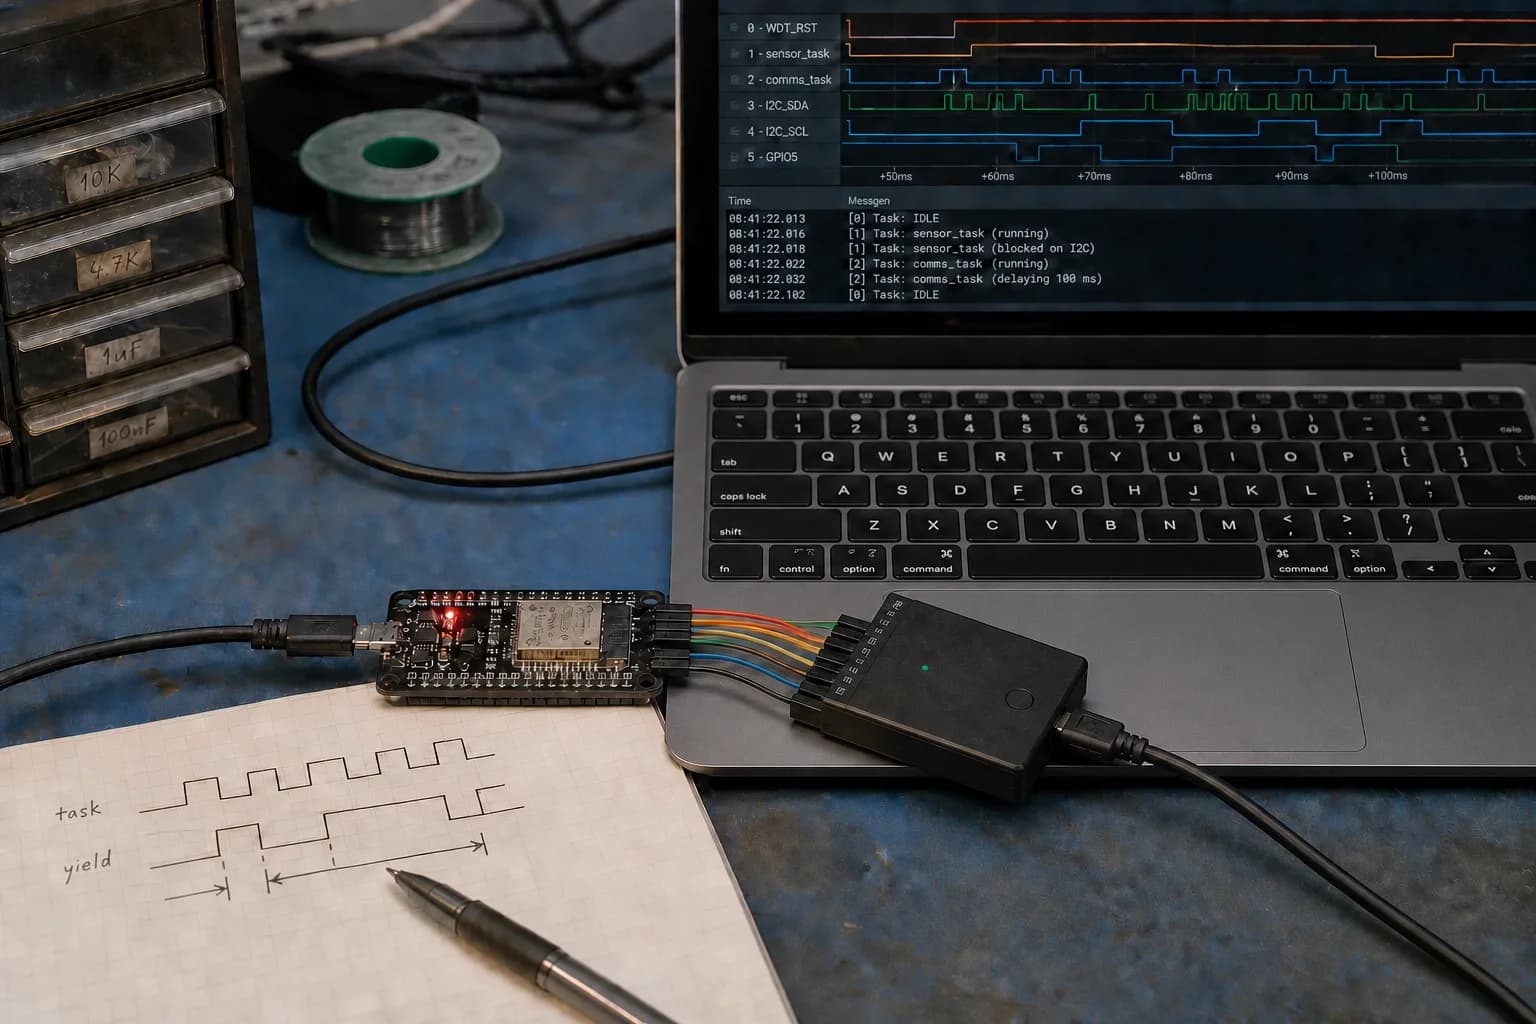
A watchdog warning often means a task, callback, or critical section held the CPU for too long.
The Task Watchdog often means that a task ran long enough to prevent an Idle Task from running. Familiar causes include:
- A compute loop that never blocks or yields.
- Waiting forever for a mutex, socket, or I/O operation.
- Decoding an image, parsing a large document, or writing flash inside a callback.
- Holding a critical section while performing slow work.
This loop looks harmless but can occupy a CPU indefinitely:
while (true) {
    process_next_audio_sample();
}
Adding vTaskDelay(1) may silence the watchdog without fixing the design. For continuous data, I divide work into bounded blocks, wait on a queue, and let the task remain blocked while there is nothing to process:
audio_block_t block;
while (xQueueReceive(audio_queue, &block, pdMS_TO_TICKS(1000))) {
    process_audio_block(&block);
}
Network callbacks, timer callbacks, and event handlers should do short work: copy the necessary metadata, send a message to a queue, and return. Encoding, filesystem operations, and HTTP work belong in a worker task.
Increasing the watchdog timeout is reasonable when the long workload is intentional, such as erasing a large flash region after measuring its worst-case duration. If a task is stuck on a mutex, reconnect loop, or spinloop, a longer timeout merely leaves the product frozen for longer before recovery.
3. Low heap and memory fragmentation
Heap failures usually fall into three different cases:
- Total memory is genuinely exhausted.
- Memory leaks a little on every cycle and never returns.
- Total free heap is still substantial, but it is split into blocks too small for the next allocation.
JSON documents, image framebuffers, audio buffers, TLS, and HTTP responses often request large blocks. I first check every allocation result:
uint8_t *frame = heap_caps_malloc(frame_size, MALLOC_CAP_8BIT);
if (frame == NULL) {
    ESP_LOGE(TAG, "frame alloc failed: %u bytes", (unsigned) frame_size);
    return ESP_ERR_NO_MEM;
}
Then I log three values instead of free heap alone:
ESP_LOGI(TAG, "free=%u min=%u largest=%u",
    (unsigned) heap_caps_get_free_size(MALLOC_CAP_8BIT),
    (unsigned) heap_caps_get_minimum_free_size(MALLOC_CAP_8BIT),
    (unsigned) heap_caps_get_largest_free_block(MALLOC_CAP_8BIT));
minimum_free_size records the lowest point since boot. largest_free_block tells you the largest single allocation that can currently succeed. If free heap is 80 KB but the largest block is 12 KB, a 32 KB buffer still fails.
I reduce fragmentation by:
- Allocating long-lived buffers once during startup and reusing them.
- Parsing or streaming in chunks instead of holding a complete JSON document, image, or audio file.
- Avoiding frequent creation and destruction of mixed-size objects in a hot loop.
- Giving each buffer one clear owner and one responsibility for calling
free. - Running heap tracing around the suspected workflow instead of tracing the entire firmware.
If free heap drops after every reconnect, request, or screen transition, the pattern resembles a leak. If free heap fluctuates while the largest block steadily shrinks, fragmentation becomes the stronger suspect.
4. Stack overflow and using PSRAM in the wrong place
Large local variables, deep call chains, recursion, and library scratch buffers can consume a task stack quickly:
void render_task(void *arg) {
    uint8_t line_buffer[24 * 1024]; // too large for many task stacks
    // ...
}
Move large buffers to static storage or heap allocation, or process smaller chunks. Increasing every task stack fourfold can consume internal RAM surprisingly quickly.
I check the minimum remaining stack with:
UBaseType_t remaining = uxTaskGetStackHighWaterMark(NULL);
ESP_LOGI(TAG, "stack high-water mark: %u", (unsigned) remaining);
The closer the value gets to zero, the closer the task came to overflowing. Measure during the heaviest workflow: a TLS handshake, large frame decode, deeply nested JSON, or verbose logging. ESP-IDF specifies task stack sizes in bytes, unlike Vanilla FreeRTOS APIs that traditionally use words.
PSRAM suits framebuffers, audio caches, model data, and large payloads that do not require strict DMA capabilities. I do not treat it as free replacement memory:
- Task stacks normally remain in internal RAM by default.
- DMA descriptors and many DMA buffers require suitable capability flags, commonly internal DMA-capable memory.
- PSRAM can become inaccessible while the flash cache is disabled.
- Small, frequently accessed data may run slower and evict flash data from cache.
- Every
MALLOC_CAP_SPIRAMallocation can still fail and must be checked.
A practical split is to keep queues, control state, task stacks, DMA, and hot data in internal RAM, while moving image frames, large audio blocks, and colder caches into PSRAM.
5. FreeRTOS and concurrency failures
Two tasks reading one buffer may be safe. One task writing while another reads creates the intermittent failures: torn frames, corrupt JSON, a pointer changing midway, or a crash that appears only while Wi-Fi is busy.
I choose the synchronization primitive based on what the data means:
- A mutex when one resource has one owner at a time.
- A queue when passing a message or transferring buffer ownership.
- An event group for a set of states such as
WIFI_READY,TIME_SYNCED, andOTA_ACTIVE. - A task notification for lightweight ISR-to-task signaling or a simple producer–consumer path.
Do not hold a mutex while waiting for network, filesystem, or a slow sensor. Copy the required state, release the lock, and perform I/O afterward. Pinning two tasks to different cores does not solve a race; shared memory remains shared.
Inside an ISR, I keep work minimal and use FromISR APIs to wake a task that continues processing. An ISR should not block, wait for a mutex, print long logs, or allocate and free memory casually. If an operation can take an unbounded amount of time, it does not belong in an ISR.
6. Wi-Fi or BLE disconnects repeatedly
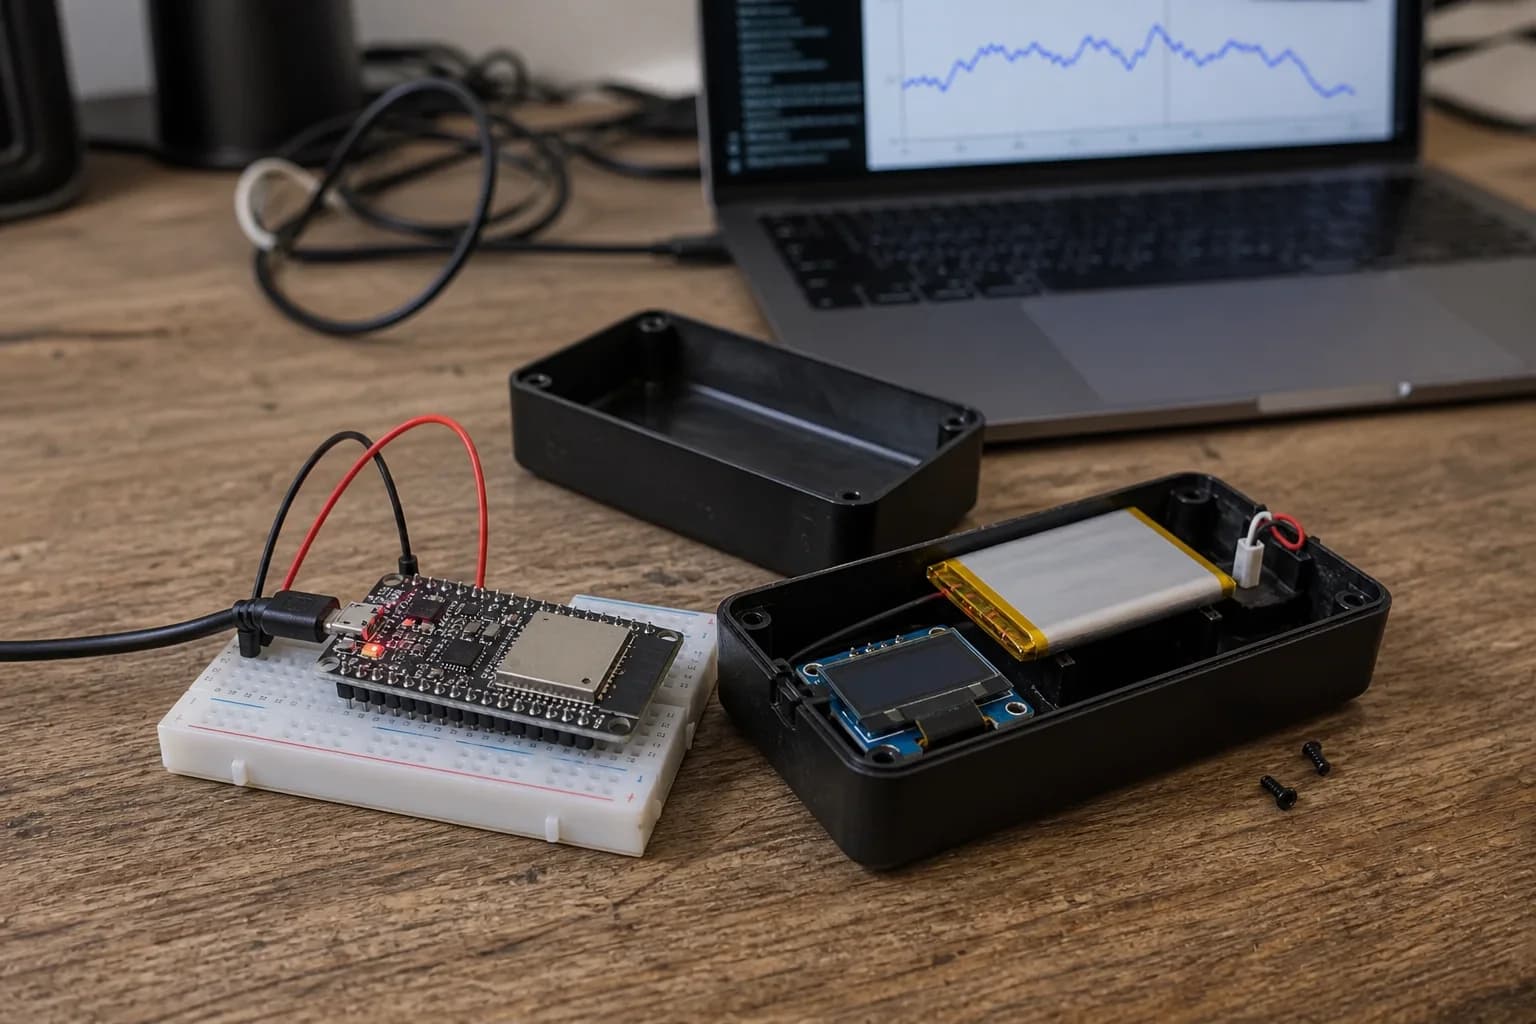
Separate RF, antenna, and power-save problems from server or socket failures before rewriting reconnect logic.
Before editing reconnect logic, remember that common ESP32 Wi-Fi supports 2.4 GHz only. A router combining 2.4 and 5 GHz under one SSID, band steering, or a crowded channel can make a test look inconsistent.
I check in this order:
- Log the disconnect reason and RSSI before reconnecting.
- Test close to a known-good 2.4 GHz access point.
- Check whether a battery, metal enclosure, display, or ground plane covers the antenna region.
- Try another power-save setting and compare latency or packet loss.
- When Wi-Fi and BLE run together, measure throughput and latency again because they share RF time slices.
A poor reconnect loop often amplifies the original failure. Every disconnect creates another task, event handler, socket, or buffer. Hours later, the heap falls, the watchdog fires, and the new errors hide the first disconnect reason.
Reconnect logic should have one owner, a state machine, and bounded exponential backoff. Do not reconnect continuously inside the disconnect callback. Also separate “RF link lost” from “Wi-Fi is connected, but DNS, TCP, or the server failed.” Restarting the whole Wi-Fi stack for every HTTP error is usually too aggressive.
7. ADC readings are wrong or noisy
Attenuation sets the useful input range; it is not overvoltage protection. Maximum voltage and measurement range vary by chip, so I check the datasheet for the exact ESP32, C3, or S3 instead of copying one universal table.
The integrated ADC is not perfectly linear, and reference variation exists between chips. If absolute accuracy matters, use the calibration API, measure several points against a known source, and consider an external ADC.
For noisy signals, I usually:
- Lower the signal source impedance or add a suitable RC filter.
- Take multiple samples and use a median or average instead of trusting one conversion.
- Keep analog routing away from the antenna, clocks, SPI, and switching supplies.
- Compare samples while Wi-Fi is idle, without treating that as the final fix when the product must transmit during normal operation.
- Give the sensor a clean ground return sharing the ESP32 reference.
On the original ESP32, Wi-Fi uses ADC2, so ADC2 conversions may fail or become unavailable while Wi-Fi is active. This restriction applies to ADC conversion; it does not ban those pins from digital GPIO use. I prefer ADC1 for analog sensors in Wi-Fi products whenever possible.
8. Deep sleep draws too much current or wakes incorrectly
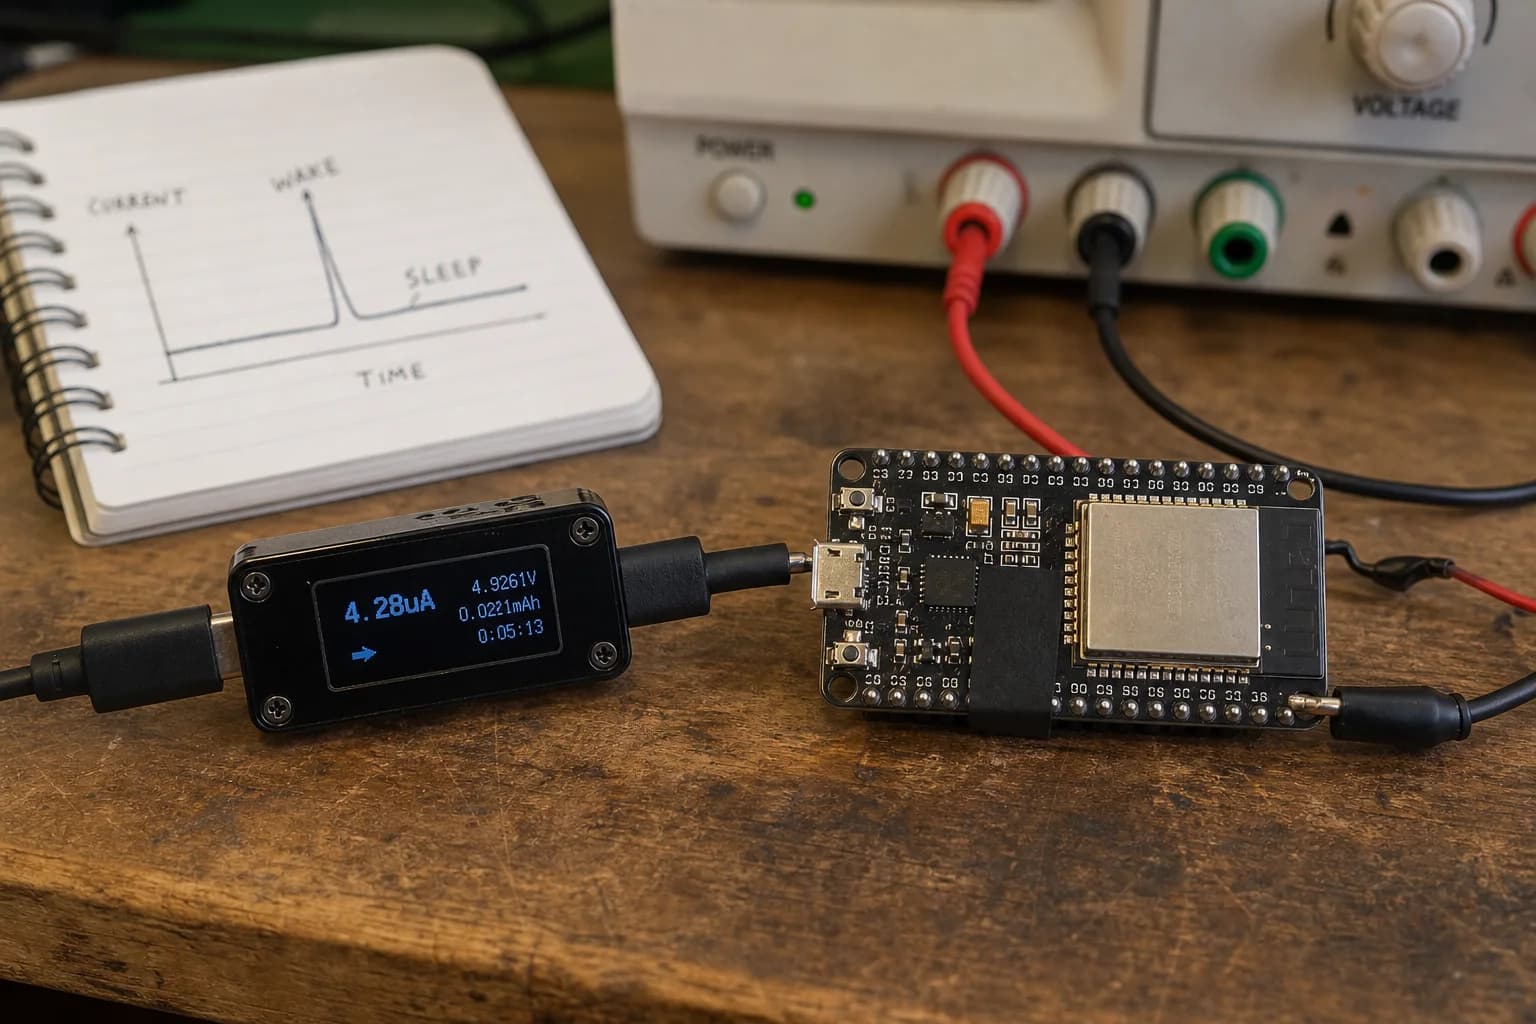
Measure the complete board because LEDs, regulators, and USB-UART bridges may remain active during sleep.
The datasheet deep-sleep figure describes the chip under specific conditions, not an entire DevKit by default. A USB-UART bridge, power LED, regulator, sensor, and pull resistors can consume far more than the sleeping ESP32.
Before sleep, I check that firmware:
- Powers down sensors, displays, amplifiers, and unused load switches.
- Drives chip-select, enable, and external GPIO lines to defined levels instead of leaving inputs floating.
- Configures pull resistors correctly and isolates GPIOs that leak through external circuits.
- Removes stale wake sources when changing sleep modes.
- Prints
esp_sleep_get_wakeup_cause()immediately after startup.
From the application perspective, deep sleep is a reset. Ordinary DRAM variables do not survive. Data marked with RTC_DATA_ATTR can survive while RTC memory remains powered; data that must survive a complete power loss belongs in NVS/flash or external storage. Writing flash before every short sleep also adds wear, so batch or reduce those writes.
For a valid current measurement, I bypass the USB-UART path where possible, disable the power LED, or use a board designed for low-power measurement. The meter needs low enough burden voltage and enough dynamic range to capture sleep current and wake bursts. A slow average can hide spikes or make the board appear never to sleep.
If the board wakes immediately, read the wake cause and measure the actual level on the wake pin. A level-triggered source wakes at once when the pin is already at its active level before sleep begins.
9. OTA fails: check the slot before the network
A 1.7 MB firmware image cannot fit a 1.5 MB OTA slot even when the module has 8 MB of flash. OTA cares about the destination partition, not the total flash printed on the module.
A safe layout normally includes otadata and at least two application slots such as ota_0 and ota_1; a factory image is optional depending on the product. Before release, I verify that:
- The binary is smaller than the OTA slot with reasonable growth margin.
- The partition table on deployed devices matches the release build.
- The device validates image metadata, version, and target chip before switching boot partitions.
- Power remains stable while Wi-Fi and flash are active together.
- Downloads have timeouts, report TLS/HTTP errors, and cannot enter an infinite update loop.
Rollback works only when the new firmware is not confirmed too early. On its first boot, the application should run a short self-test: storage is readable, configuration is valid, essential tasks run, and the network stack does not crash. Only then should it call esp_ota_mark_app_valid_cancel_rollback(). A failed test should mark the image invalid and return to the previous one.
For a remote device, I still want a recovery path outside the normal OTA workflow: a minimal factory/recovery image or at least accessible serial download test points. Losing power during a safe application OTA should preserve the currently running image, but updating the partition table or bootloader carries much greater risk.
10. Runtime troubleshooting checklist
When an ESP32 runs normally and later fails, I follow this exact sequence:
- Reset reason: panic, watchdog, brownout, deep-sleep wake, or software reset?
- Backtrace: preserve the full log, firmware version, and matching ELF.
- Watchdog: which task did not yield, which callback did heavy work, and which lock waited too long?
- Heap: log free, minimum free, and largest block; check loss across repeated cycles.
- Stack: measure the high-water mark under the heaviest workload and find large local buffers.
- Tasks: identify buffer ownership, mutexes, queues, and every path originating in an ISR.
- Network: log reason codes, RSSI, backoff, power save, and Wi-Fi/BLE coexistence.
- Power and ADC: measure the rail during radio activity and verify analog ground and attenuation.
- Deep sleep: read the wake cause, shut down peripherals, and measure the whole board.
- OTA: verify slot size, image size, first-boot self-test, rollback, and recovery.
The most valuable artifact is the first failure. After a null pointer, reconnect storm, or heap corruption, later watchdog and network errors are often cascading symptoms. Starting from the reset reason and the first application frame is much faster than beginning with a larger timeout or a full-system restart.
Conclusion
ESP32 runtime bugs are rarely truly random. They happen at a timing, load, or memory state that we have not captured yet. A backtrace shows where code stopped; the watchdog shows who held the scheduler; heap and stack metrics show where resources went; reset reason and wake cause connect those clues into one story.
I change one variable at a time, keep logs from before and after the change, and rerun the exact workload that triggered the failure. It takes a few extra minutes at the beginning and saves days of “fixed, but I do not know why.”
References
- espressif/esp-idf: Fatal Errors
- espressif/esp-idf: Watchdogs
- espressif/esp-idf: Heap Memory Debugging
- espressif/esp-idf: Heap Memory Allocation
- espressif/esp-idf: External RAM
- espressif/esp-idf: FreeRTOS (IDF)
- espressif/esp-idf: Wi-Fi Performance and Power Save
- espressif/esp-idf: ADC Oneshot Example
- espressif/esp-idf: Deep Sleep Example
- espressif/esp-idf: OTA Examples
- espressif/esp-idf: OTA and Rollback
Share
Keep exploring
Read next
Related articles
Real-Time Operating System (RTOS): FreeRTOS on ESP32
A beginner-friendly guide to using FreeRTOS on ESP32 for multitasking firmware with tasks, queues, notifications, mutexes, and practical debugging habits.
RISC-V Embedded Development: Getting Started with ESP32-P4
A practical ESP32-P4 RISC-V guide: install ESP-IDF, select the esp32p4 target, build a first project, flash over USB, and understand the dual-core architecture.
ESP32 Memory Management Deep Dive: SRAM, PSRAM, Heap and FreeRTOS Stacks
A practical ESP32 memory guide covering SRAM layout, PSRAM usage, heap fragmentation, RTOS task stacks, and small optimization tricks that are useful in real firmware.